
Lesson 8- Test Plates & Interferometry
What You Will Learn
- Principles of test-plate Newton rings
- Power and irregularity assessment
- Strengths and weaknesses of interferometry
Why these methods matter
Both techniques use light interference to turn nanometer-scale height errors into visible patterns. A simple test plate on a bench can quickly show whether a surface is too strong/weak (power error) or wavy (irregularity). A modern interferometer automates the same physics to deliver a dense 3D height map with numbers you can trust for acceptance tests and process control.
Core idea of Newton rings
Place a polished optic against a high-quality reference surface (the “test plate”). A thin air film remains between them. When illuminated with monochromatic light, reflections from the top and bottom of that film interfere. Where the optical path differs by an integer multiple of the wavelength, the film looks bright or dark. Concentric rings imply an approximately spherical match; off-center or uneven rings reveal tilt or wedge. If the optic is slightly stronger or weaker than the reference, ring spacing changes with radius; if the edge is high, the outer ring closes tighter on one side. A useful mental model is that each bright or dark ring corresponds to a contour line of constant air-gap thickness. Changing the pressure or adding a tiny shim at the edge shifts all rings uniformly—evidence you changed the gap, not the surface.
Quick physics relationship
For a spherical surface on a flat, the squared radius of the m-th ring is proportional to m times the wavelength times the surface’s radius of curvature. That is why shorter wavelengths produce tighter rings and why switching filters can improve readability. In practice you do not need to compute radii; you compare patterns to a known good part or a test plate with certified power.
You need a clean, dust-free bench, a reference flat or reference sphere (the test plate), a stable monochromatic source such as a sodium lamp, green LED with narrowband filter, or a helium-neon laser with diffuser, and minimal fixturing so the optic can sit without rocking. Optics intended for contact should be uncoated or have robust coatings; for delicate optics, keep the surfaces a hair apart and use an indicator to control the gap rather than pressing to hard contact.
Performing the Newton test
Start by cleaning both surfaces with appropriate tissue and solvent; one speck of grit will create a false bright spot and can scratch. Introduce the test plate at a shallow angle so air can escape, then gently settle it until rings appear. Adjust tilt to center the bullseye if the surfaces are nominally spherical. If rings race in one direction as you press, you are changing the average gap; if rings shear locally, you are revealing irregularity. To read power, compare the ring count across a known diameter to what you expect for a perfect match. More rings over a given span means a stronger difference in curvature between the part and the plate; fewer rings means a weaker difference. To read irregularity, look for rings that are not perfectly circular, have flats or kinks, or exhibit periodic scalloping, that is mid-spatial error or zonal structure. The rings are interference fringes from a thin air gap between a reference surface and a test surface. Bright/dark bands are contour lines of equal gap thickness. Change wavelength (λ), curvature (R), or tilt to see the pattern reshape. Bright/dark rings are contour lines of equal air‑gap thickness. Concentric rings ⇒ spherical match. Off‑center/straight bands ⇒ added tilt.
![]()
What you’re seeing
Interpreting power and irregularity
Power is the best-fit sphere mismatch, think “too steep” or “too shallow.” You remove it by re-tooling your polishing lap or by returning to a generating step. Irregularity is the residual after subtracting power and tilt, this is what interferometer reports call “irregularity,” “PV,” or “RMS.” Rings that bunch tightly in one sector indicate a localized high zone. A uniformly egg-shaped bullseye hints at astigmatism. Straight, evenly spaced bands across the aperture usually mean you are viewing with a deliberate small tilt to count fringes; if those bands bend, the bending shows the surface departure. Test plates are fast, inexpensive, and great for work-in-process checks, but they depend on operator skill and a well-characterized reference. They are sensitive to dust, wedge in the part, and coating reflectivity. They offer qualitative accuracy for irregularity and a semi-quantitative read on power when you have a comparison standard. Always record the illumination wavelength, ring count across a stated diameter, and any observed asymmetries so the next operator can repeat your conditions.
From rings to maps: modern interferometry
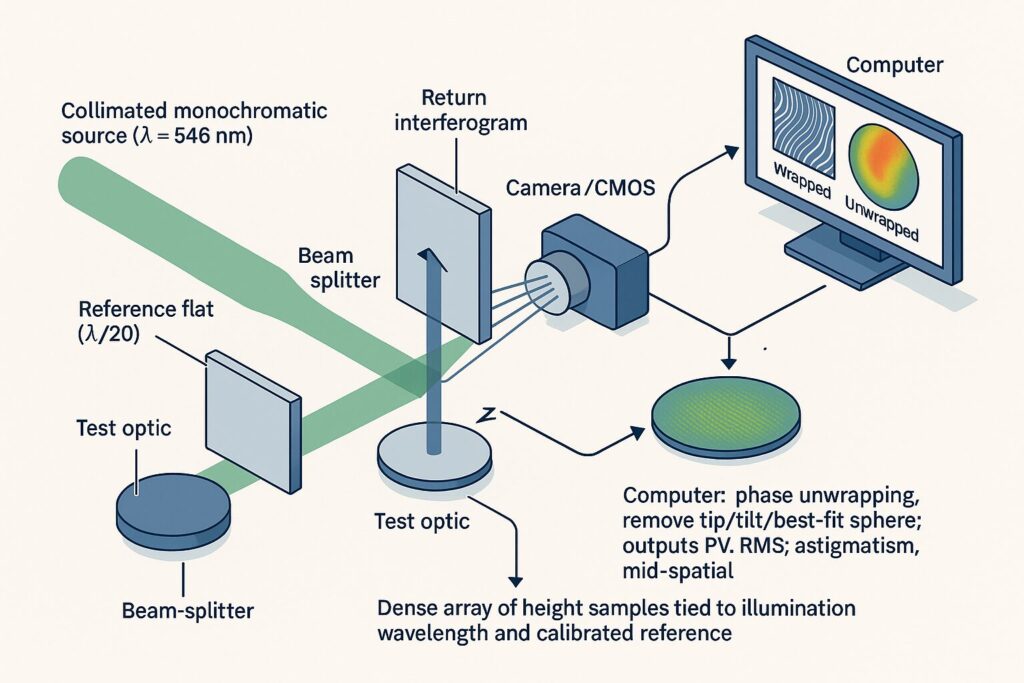
A Fizeau interferometer replaces the human eye and test plate estimation with a stable reference optic, collimated monochromatic light, and a camera. The instrument acquires several frames while shifting the phase of the test cavity by known fractions of a wavelength. Software then reconstructs a wrapped phase map, unwraps it to produce a continuous surface, and removes tip/tilt and best-fit sphere so you can read power, irregularity (PV and RMS), astigmatism, and mid-spatial statistics. The output is a dense array, often millions, of height samples tied to the illumination wavelength and the calibrated reference. Because interferometers measure phase, they are exquisitely sensitive: a single fringe corresponds to roughly half a wavelength of surface error in reflection mode and a full wavelength in transmission. Instruments report results in nanometers or in “fringes,” and can apply spatial filters to separate roughness, mid-spatial error, and figure.
Calibration, references, and traceability
Accuracy depends on the reference flat or reference sphere and the system’s calibration. Certified references carry PV and RMS maps with traceability to national standards. Regular system checks include retrace error tests, pixel-scale verification, and environmental compensation. When you must test a surface that is not naturally null with the reference (for example, an asphere), you add null optics such as a computer-generated hologram or lens compensator so the residual phase represents the departure from the intended design rather than the gross shape.
Interferometry is objective, fast, and archivable. It enables clear pass/fail criteria, trending across lots, and root-cause work using Zernike terms or spatial power spectral density. It can be limited by vibration, air turbulence, and coherence artifacts on highly reflective or multi-surface parts. Highly sloped aspheres or rough ground surfaces may not retrace well without special setups. Test plates, by contrast, work in rougher environments and excel as a “first look,” but they do not deliver the same quantitative certainty without careful comparison methods.