
What You Will Learn
- How phase-shifting interferometers measure form and waviness
- The difference between mid-spatial frequency (MSF) errors and roughness
- Why these measurements matter for high-energy laser optics
Interferometric microscopy uses light waves as a super-sensitive ruler for height. When two beams of the same color of light combine, they form bright and dark stripes called interference fringes. By shifting the phase of one beam in tiny steps and recording several images, the instrument can calculate exactly how much extra distance the light traveled at each camera pixel. That distance converts directly to surface height, creating a detailed “terrain map” of the optic at nanometer and even sub-angstrom scales.
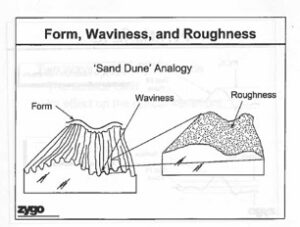
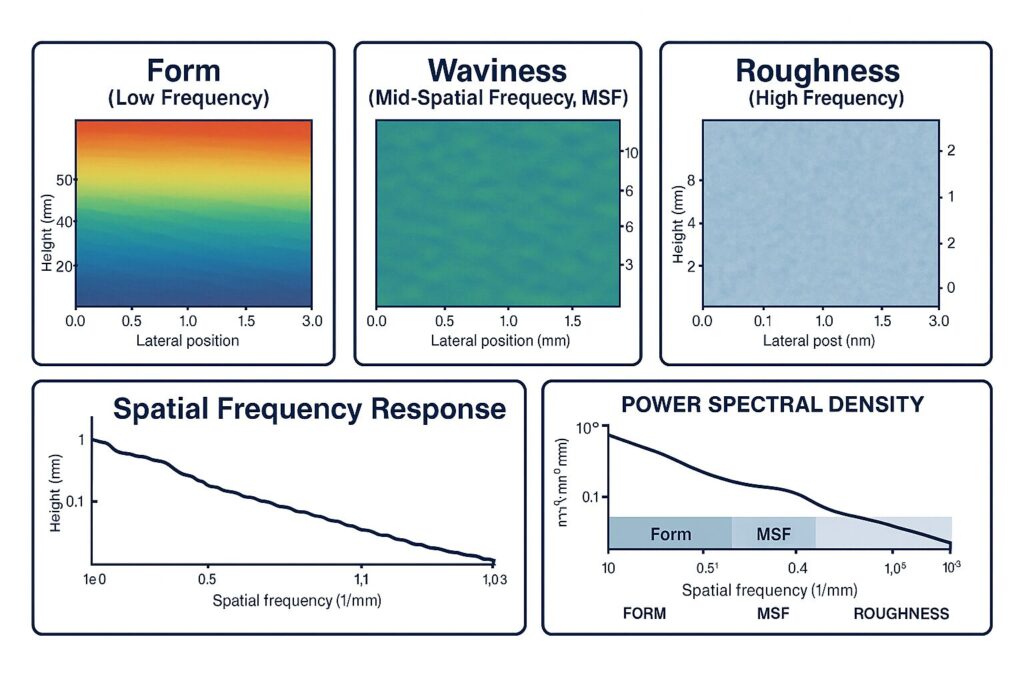
Surface quality shows up on three main scales. First is form, the big-picture shape across the whole part, like a perfect flat or a sphere; errors here look like slow, gentle hills and valleys. Next is MSF, also called waviness, which appears as mid-scale ripples with spacings from tens of micrometers to a few millimeters. Finally, there is roughness, the ultra-fine texture at micron and nanometer scales that scatters light. All three can exist at once. We separate them because each one affects optical performance differently and are specified differently on a drawing.
Phase-shifting interferometers work by comparing light reflected from the test surface to light from a stable reference path. As the instrument shifts the phase through fractions of a wavelength, the brightness at each pixel rises and falls in a predictable way. Software uses those changes to solve for the optical phase and then converts phase to surface height. After that, the system mathematically removes a best-fit flat or sphere to isolate form errors and can apply filters to study only the mid-scale band (for MSF) or only the highest frequencies (for roughness). Reports typically include a false-color height map, a raw fringe image that shows how straight or curved the fringes are, and summary numbers like peak-to-valley (PV) and root-mean-square (RMS) height over the field.
 MSF and roughness matter for different reasons. MSF redistributes light in semi-directed ways, which can reduce image contrast and create faint rings or ripples in imaging systems. In high-energy lasers, MSF can concentrate energy into local hot spots that raise the chance of damage. Roughness, on the other hand, mainly causes diffuse scatter—a hazy loss of transmitted or reflected power, which can seed laser damage or heat parts unevenly. A surface can show excellent roughness yet still fail an MSF requirement if mid-scale ripples remain, so metrology must report band-limited results, not just a single overall number.
Because microscopes see only a small area at once, many instruments “stitch” measurements together by scanning the stage and overlapping tiles. Stitching builds a larger map with consistent height across seams, giving a truer picture of the whole optic’s behavior. The trade-off is time and careful alignment: poor stitching can add artificial steps or waves if the tiles are not registered correctly.
Trustworthy numbers depend on clean, stable setups. Dust can masquerade as “mountains,” vibration blurs fringes, and airflow can distort the phase. Shorter wavelengths improve vertical sensitivity but tolerate less surface slope; longer wavelengths are more forgiving but measure slightly coarser. Data filtering must be documented and used carefully: over-filtering can hide the very errors you need to control. Typical vertical units are nanometers (nm) and angstroms (Å), while lateral feature sizes are in micrometers (µm).
Consider a real-world example. You measure a laser window and find extremely low roughness, great news, but the band-limited MSF RMS is above spec. The height map shows gentle ripples repeating about every 200 micrometers. That pattern often points to polishing tool marks or an unstable dwell pattern. The fix might involve changing slurry chemistry, tool stiffness, or the polishing path to smooth the mid-scale band without over-polishing the whole part.
In summary, interferometric microscopy turns interference fringes into precise height maps that separate form, MSF, and roughness. By understanding what each band means physically, and how each one affects light, you can tune manufacturing steps to meet strict optical and laser-damage requirements while trusting that your measurements truly reflect the surface you built. The suggested graphic for this lesson is a three-panel view of the same area filtered into form, MSF, and roughness, with an accompanying plot that highlights the frequency ranges each panel represents.